Master Advanced Data Analysis with Excel’s Powerful What-If Analysis Tool in 2025
Microsoft Excel has a host of powerful data analysis features. One such feature that allows you to examine various “what if” scenarios is known as the What-If Analysis Tool. It encompasses a set of different tools: Scenarios, Data Tables, and Goal Seek, each serving distinct purposes.
The What-If Analysis in Excel is an essential tool for any data analyst, business strategist, financial planner, or anyone looking to project outcomes based on variable data. Its primary function is to allow the exploration of different outcomes or “what-if” scenarios, providing insights on how varying input values can affect the result of your data model.
Why Use What-If Analysis?
The utility of What-If Analysis lies in its ability to streamline the decision-making process. In business scenarios, for instance, you can adjust values to forecast profits for different pricing strategies, sales volumes, or cost structures. For personal finance, you could use it to evaluate different investment or savings scenarios based on varying interest rates, time periods, or deposit amounts.
Beyond finance, the What-If Analysis tool can be utilized in a myriad of contexts. Scientists can use it to assess different outcomes of an experiment based on varying parameters. Engineers can use it to predict the performance of a structure under different load conditions. In logistics, it could be used to optimize routes under different traffic scenarios.
The inherent value of the What-If Analysis tool is its ability to simulate different conditions without altering the actual data. It lets you experiment with, analyze, and understand the potential impact of changes to your data, aiding in risk assessment and facilitating strategic planning. In essence, the What-If Analysis tool is not just a feature in Excel; it’s a vital instrument for data-driven decision-making, offering a comprehensive way to predict outcomes, plan strategically, and make informed decisions.
What are various ways to Insert time format automatically in Excel
Approach 1: Scenario Analysis: Compare different data scenarios in the same set of cells.
Approach 2: Data Tables: See the effects of different input values in one or two variables in your formulas.
Approach 3: Goal Seek: Find the necessary input for a given outcome.
Implementing Scenario Analysis
Scenario Analysis in Excel involves creating different data scenarios and comparing their outcomes. It’s done through the Scenario Manager under ‘What-If Analysis’ tools. You define various scenarios by providing different values for the same set of cells, then save them. Later, you can switch between these saved scenarios to observe how changes in input data affect the output. This feature is invaluable for exploring a range of possible outcomes and making informed decisions based on a variety of “what if” situations. It’s particularly useful in financial modeling and risk assessment.
Step 1: Select the cells that contain different data for different scenarios.
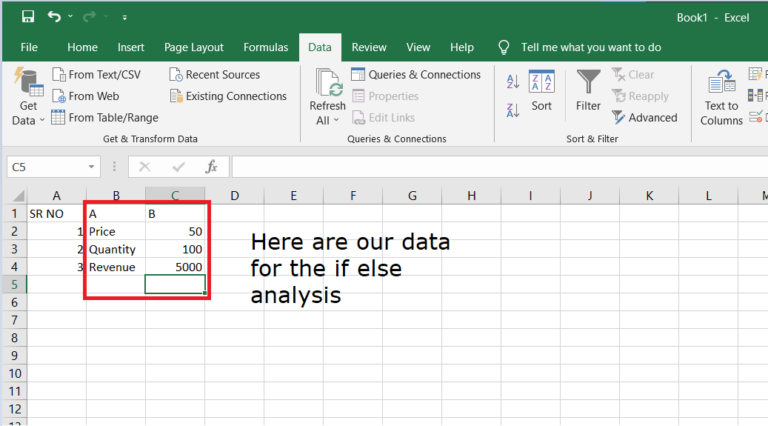
Step 2: Click on the ‘Data’ tab, choose ‘What-If Analysis’, then select ‘Scenario Manager’.
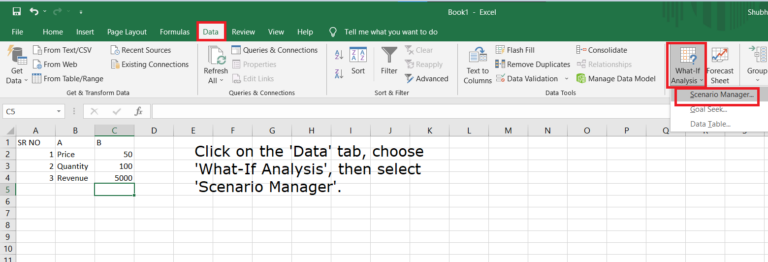
Step 3: Click on the ‘Add’ button to create a new scenario.

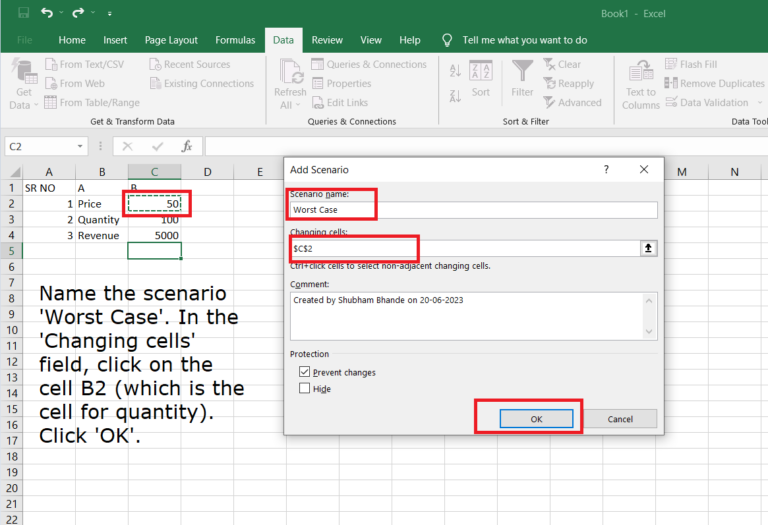
Step 4: Name the scenario ‘Worst Case’. In the ‘Changing cells’ field, click on the cell B2 (which is the cell for quantity). Click ‘OK’.
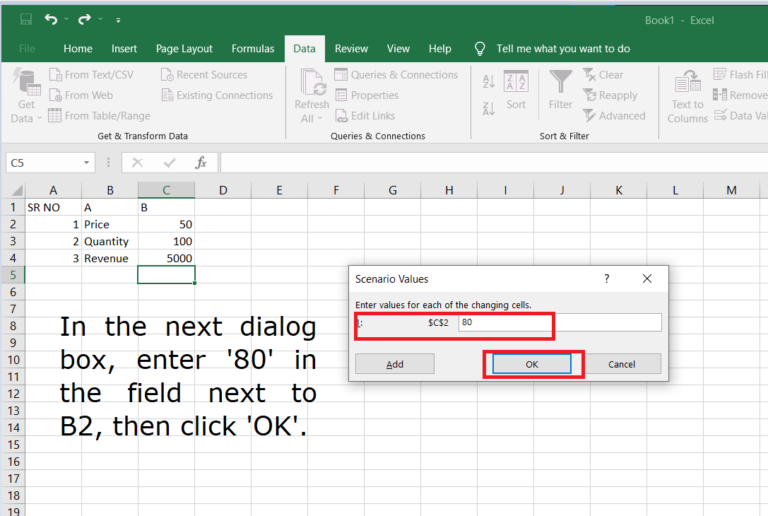
Step 5: In the next dialog box, enter ’80’ in the field next to B2, then click ‘OK’.
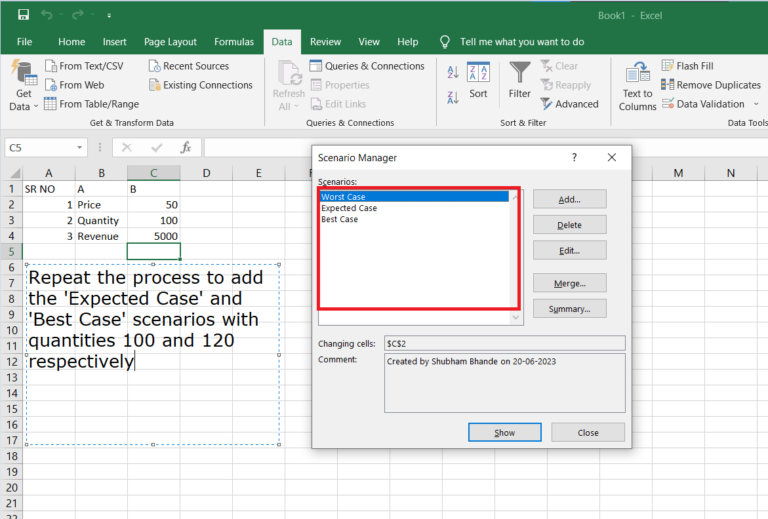
Step 6: Repeat the process to add the ‘Expected Case’ and ‘Best Case’ scenarios with quantities 100 and 120 respectively.
Step 7: Select a scenario and click ‘Show’. This will update the cells specified in the scenario.
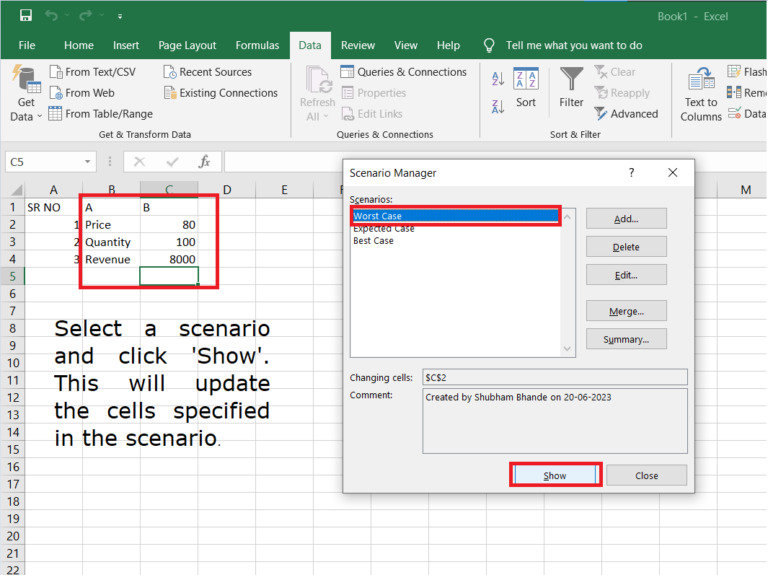
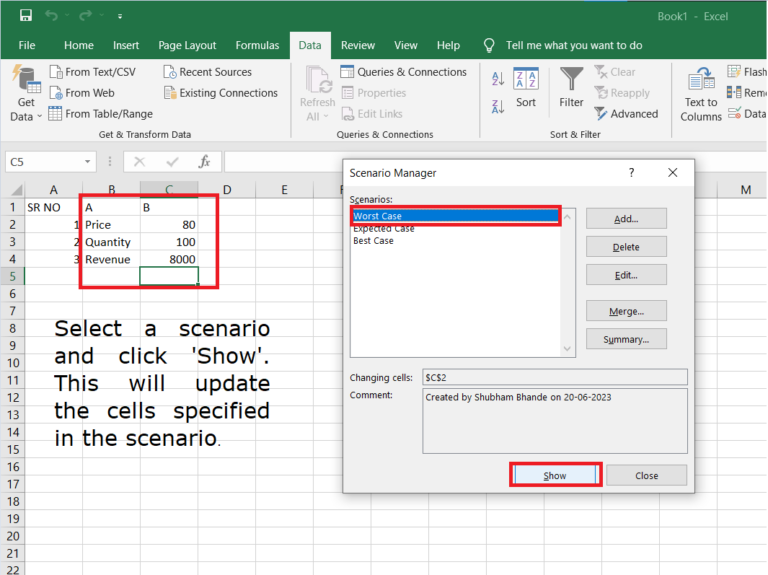
Step 8: Observe the change in total revenue for each scenario.
1. For wrost case:
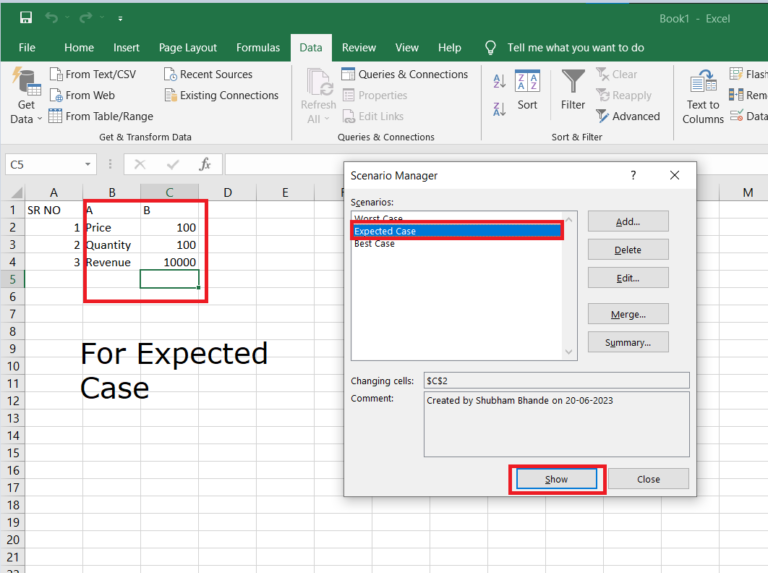
2. For Expected Case:
3. For Best Case:
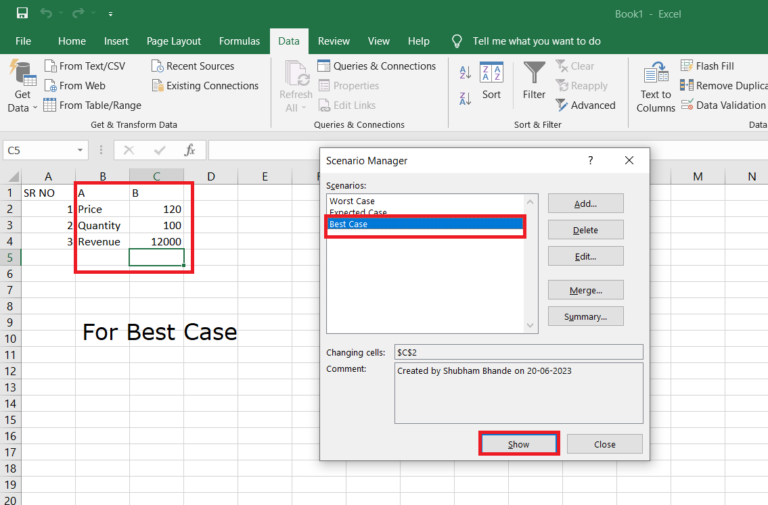
Using this approach, the business owner can model the revenue outcomes for different sales volumes. This powerful tool allows the easy assessment of potential impacts of various business conditions.
Creating Data Tables
Data Tables in Excel are part of the ‘What-If Analysis’ tools. They provide a way to view and compare the outcomes of changing one or two variables in your formula. A one-variable data table examines the possible outcomes for different values of one input, whereas a two-variable data table allows you to see how different combinations of two inputs will affect an output. This makes data tables a powerful tool for sensitivity analysis, enabling users to understand how changing input values will impact the results of their data models.
Step 1: Create a data set.
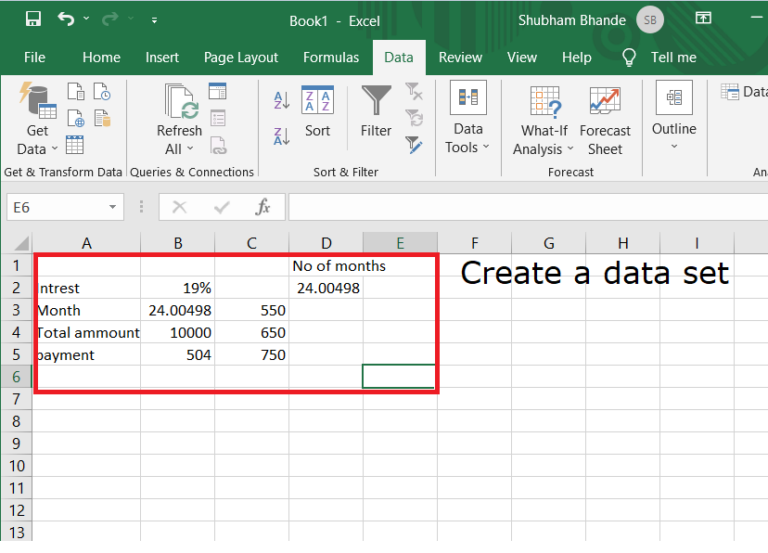
Step 2: Select the desired table and click on data table and next click on what if analysis then select data table

Step 3: Select the payment cell in column input cell we need output in column
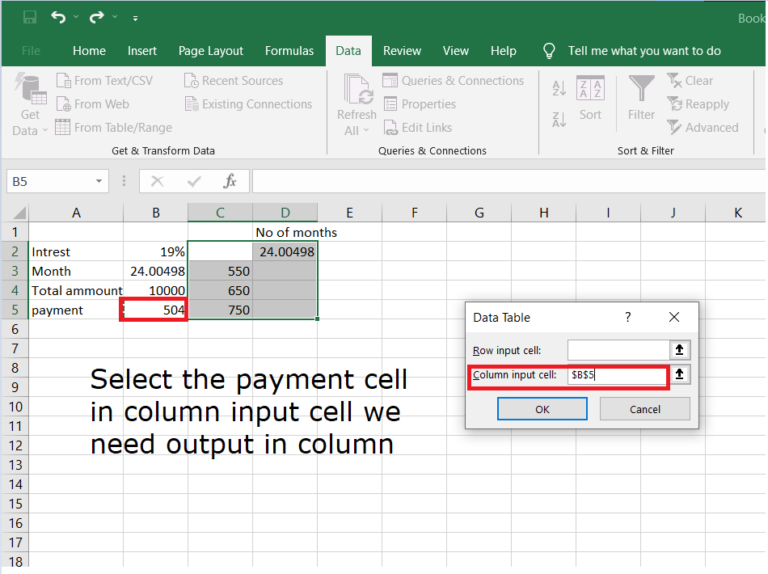
Step 4: After pressing ok you will get desired output in column

Applying Goal Seek
Goal Seek in Excel is a tool used to find the required input value to achieve a desired result. It essentially ‘reverse engineers’ the output of a formula. By specifying the target value and the cell to change, Excel adjusts the input to achieve the set goal.
Step 1: Import new that you want to analysis

Step 2: Click on Data tab Click on the ‘What-If Analysis’ button in the ‘Data’ tab, and select ‘Goal Seek’.

Step 3: In the ‘Goal Seek’ dialog box, for the ‘Set cell’ field, select the cell containing the formula. For the ‘To value’ field, enter the desired result. For the ‘By changing cell’ field, select the cell of the variable to be adjusted.
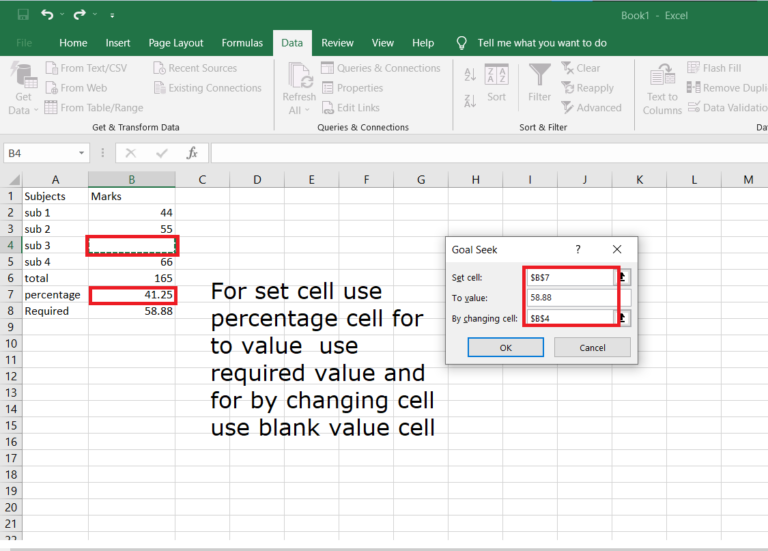
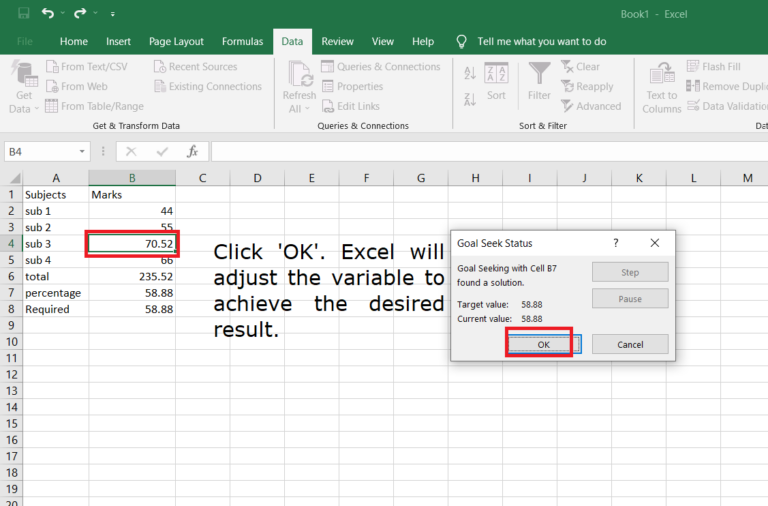
Step 4: Click ‘OK’. Excel will adjust the variable to achieve the desired result.
Conclusion
The What-If Analysis tools in Excel provide powerful methods to perform complex data analysis and make predictions based on variable data. Using Scenario Manager, Data Tables, and Goal Seek, you can explore different scenarios, assess the impact of changing input variables, and determine necessary input values to achieve a specific goal.
One can apply these tools widely, from financial and risk assessment to strategic planning and scientific research. It bears mentioning that having a solid grasp on data structure and formula functions is crucial when performing any data analysis approach. Always ensure that your formulas are accurate by meticulously checking your outcomes for correctness. Be aware that changing inputs can affect multiple formulas, so proceed with caution when changing your data.


