How to Use Excel for Forecasting and Predictive Analytics in 2025: Data Analyst Special
Why use Excel for Forecasting and Predictive Analytics?
In today’s rapidly evolving business landscape, utilizing advanced tools like Microsoft’s powerhouse Excel is essential not only for basic number crunching but also as an advanced analytical toolset that helps solve complex problems through forecasting and predictive analytics. By analyzing large amounts of diverse data with ease, Excel has adequately evolved as a preferred partner in making informed decisions across industries worldwide. In this article, we explore various ways users can leverage the versatile application to derive meaningful insights from incomplete or scattered input sets through accurate forecasts based on logical predictions refined over time using intuitive templates provided by the application itself!
Predictive analytics involves analyzing historical data to predict future trends or outcomes. Forecasting, a significant component of predictive analytics, deals specifically with estimating future values based on patterns and trends observed in past data.
Excel offers a number of built-in functions that allow for sophisticated forecasting and predictive analytics. In numerous sectors like retail, finance, and marketing alike, a crucial skillset that separates esteemed decision-makers from the rest is accurately forecasting the future. Taking into account historical data can help them scrutinize potential future trends; thereby enabling these individuals to make informed decisions. The applications of this skill are varied; ranging from strategic budget planning to efficient resource distribution. However, this understanding proves most critical while analyzing financial performance or predicting sales volume with some level of certainty.
What are various Ways to Use Excel for Forecasting and Predictive Analytics
Approach 1: Linear Forecasting using FORECAST function.
Approach 2: Non-Linear Forecasting using Trendline function.
Approach 3: Advanced Predictive Analytics using Data Analysis ToolPak.
Linear Forecasting using FORECAST function
The first and simplest method is linear forecasting. This involves predicting a future value along a linear trend line, essentially assuming that the relationship between the variable you’re trying to predict and the time period you’re forecasting is a straight line.
The FORECAST function in Excel is a straightforward yet powerful tool for predicting a future point along a linear trend. Here are the steps to perform linear forecasting:
Step 1: Prepare your dataset with known X’s and Y’s.
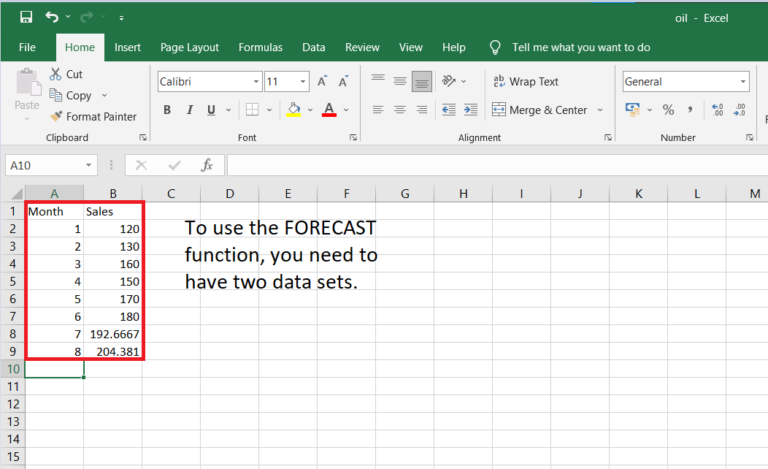
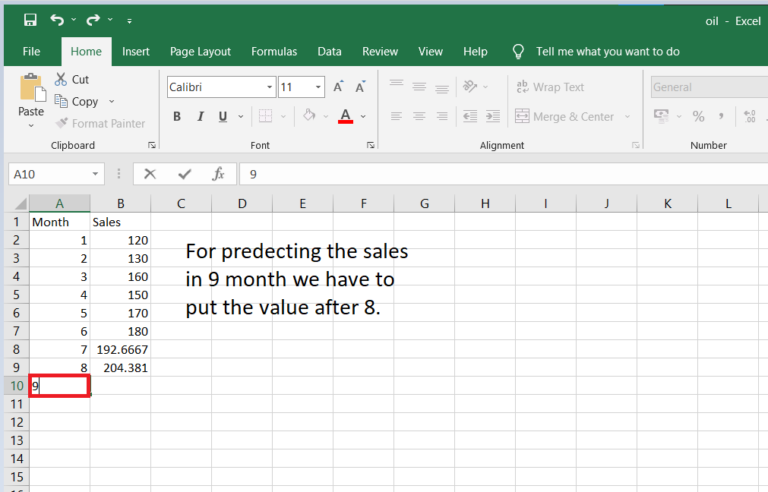
Step 2: Identify the Known and Future X Values.
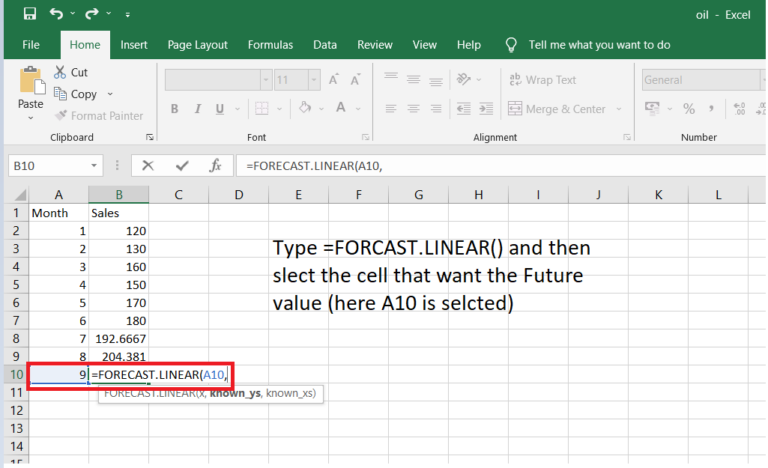
Step 3: In the cell next to your future X value, type =FORECAST(X, Known_Y’s, Known_X’s).
1. Type “=FORCAST.LINEAR()“, select the cell that we want to predict the future.
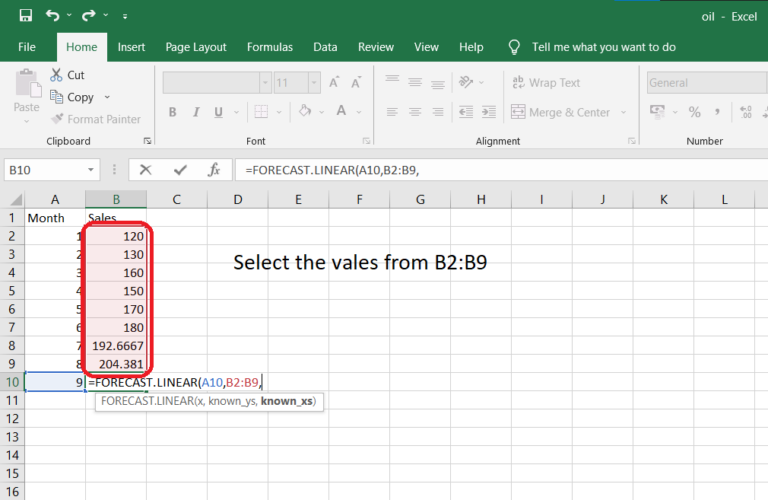
2. Now select the 2nd column all values (here we selected B2:B9)
3. Now select the 1st columns all vales (here we selected from A2:A9)
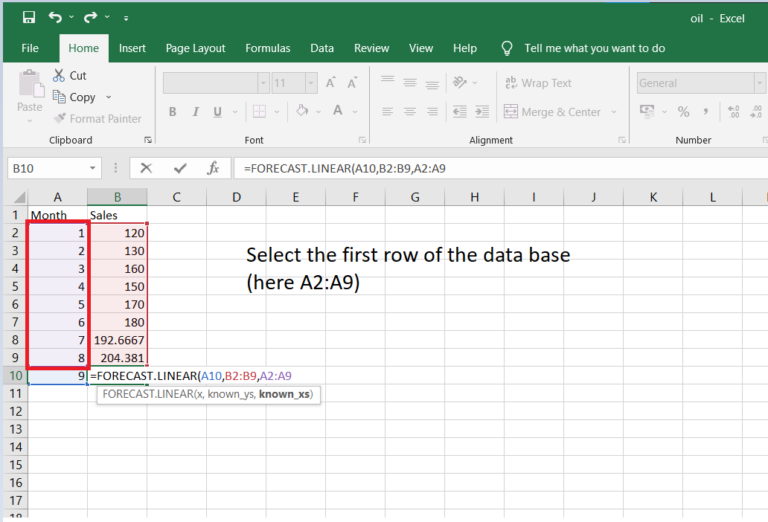
Step 4: Press Enter to get the predicted future Y value.
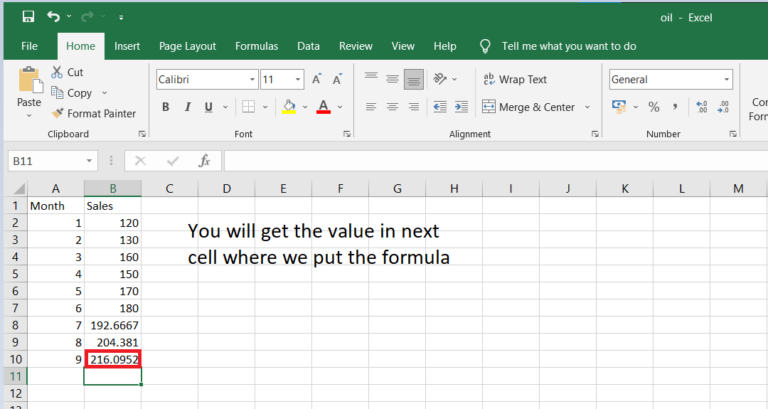
Non-Linear Forecasting using Trendline function
Sometimes, trends are not linear but follow polynomial, logarithmic, or other types of curves. In these cases, Excel’s trendline function can be a useful tool. In scenarios where data follows a more complex, non-linear trend, Excel’s trendline function is highly useful. Excel provides several types of trendlines, such as linear, polynomial, logarithmic, and exponential, allowing for flexibility based on the data trend.
Step 1: Highlight your dataset.
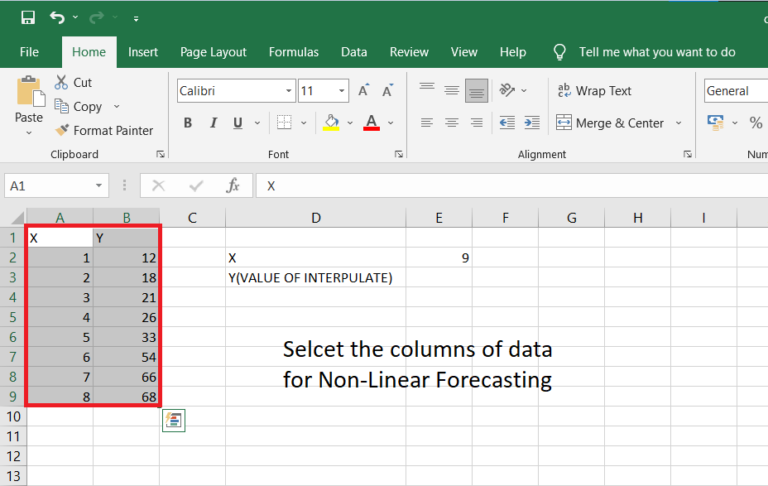
Step 2: Insert a scatterplot via the Insert tab.
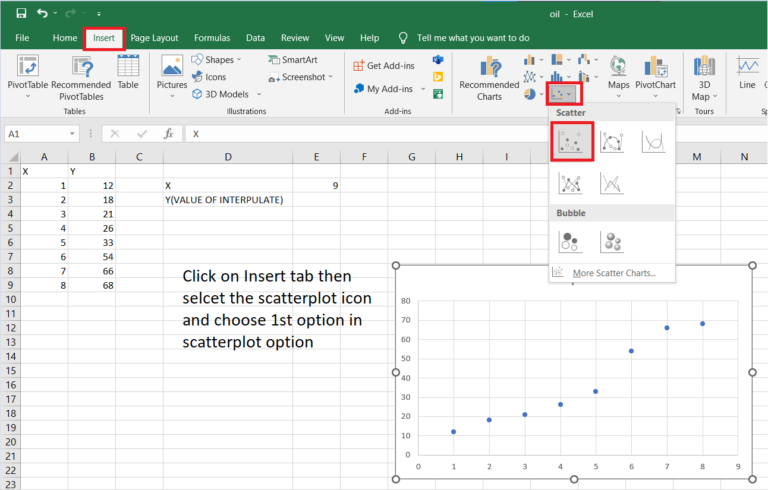
Step 3: Click on a data point in the scatterplot, and click on the ‘Add Trendline’ option in the chart design tab.
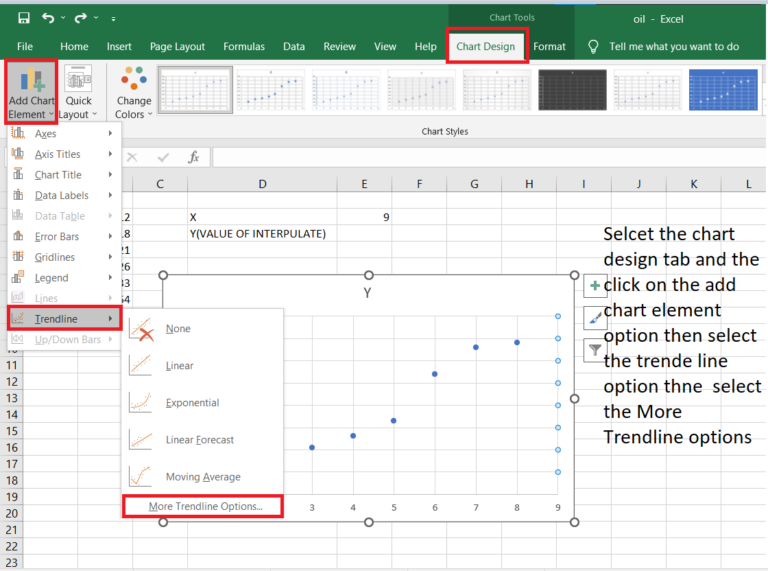
Step 4: Make sure to click on Display Equation And Display R square equation.
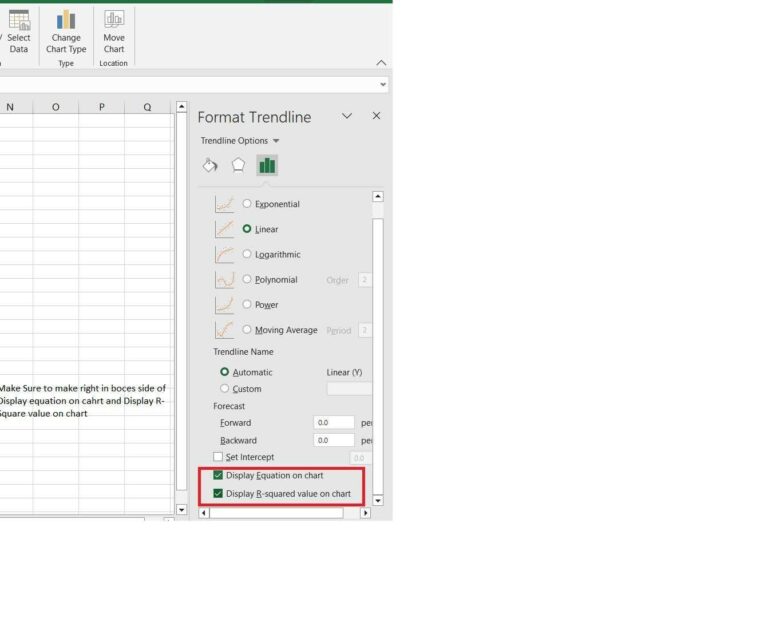
Step 5: Choose the type of trendline that fits your data trend (linear, logarithmic, polynomial, etc.). Check the ‘Display Equation on chart’ option.
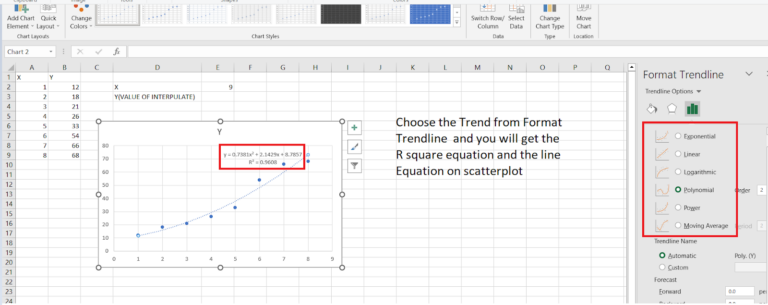
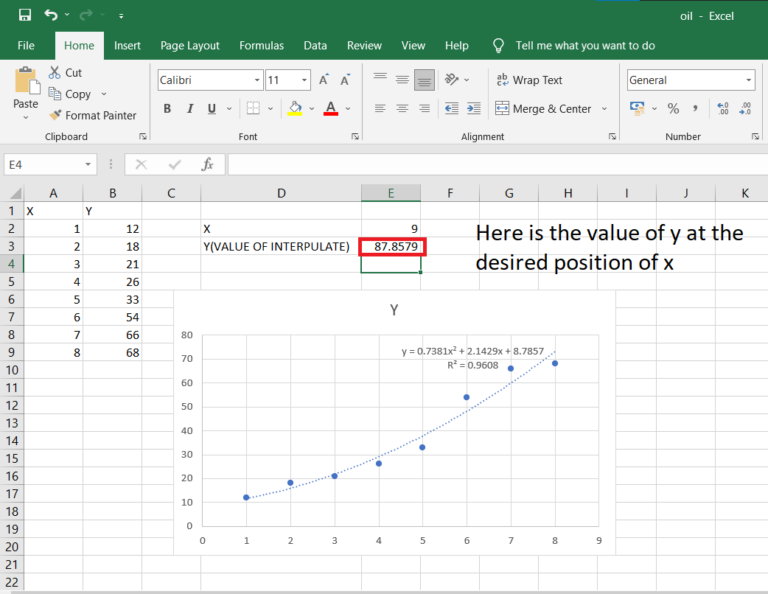
Step 6: Use equation for Predicting the Future value select the instead of X in Y equation.
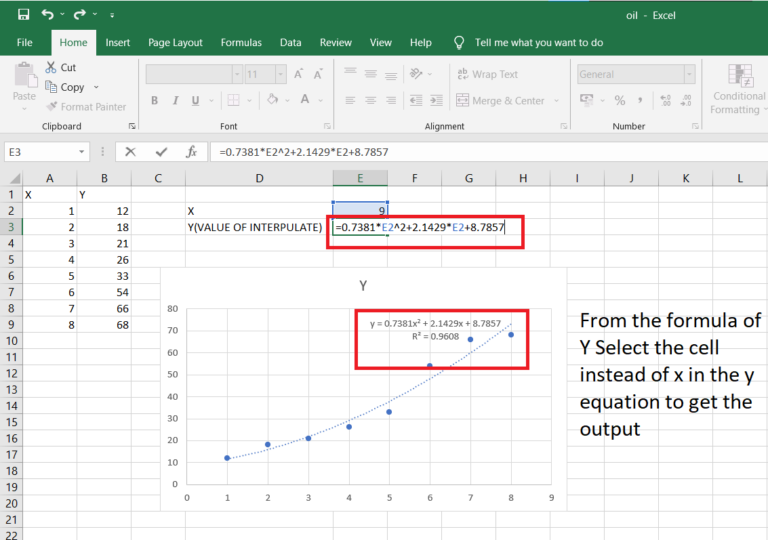
Step 7: Click enter to get the value of y at desired x.
Advanced Predictive Analytics using Data Analysis ToolPak.
Excel provides the Data Analysis ToolPak for more sophisticated predictive analytics. This includes performing regression analysis. For more complex predictive analytics, Excel offers the Data Analysis ToolPak. This add-on provides a variety of advanced statistical analysis tools, including Regression analysis.
Step 1: Click on File tab.
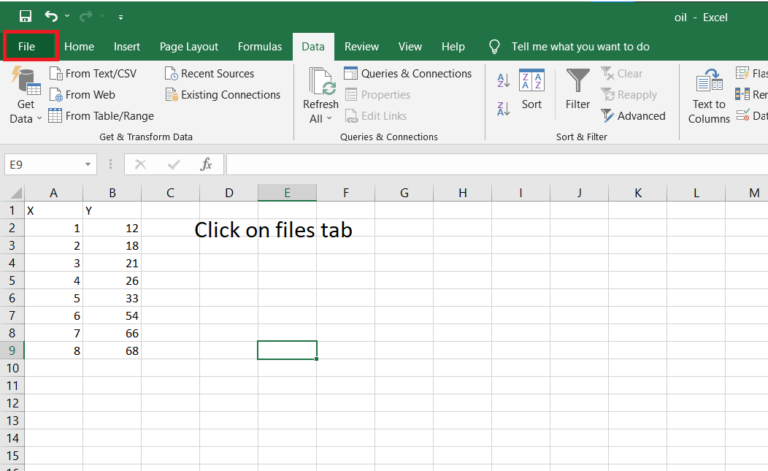
Step 2: Then Click on the Option Button.

Step 3: Now Click on the Add-ins option and then select the option Go in manage Excel add-ins.
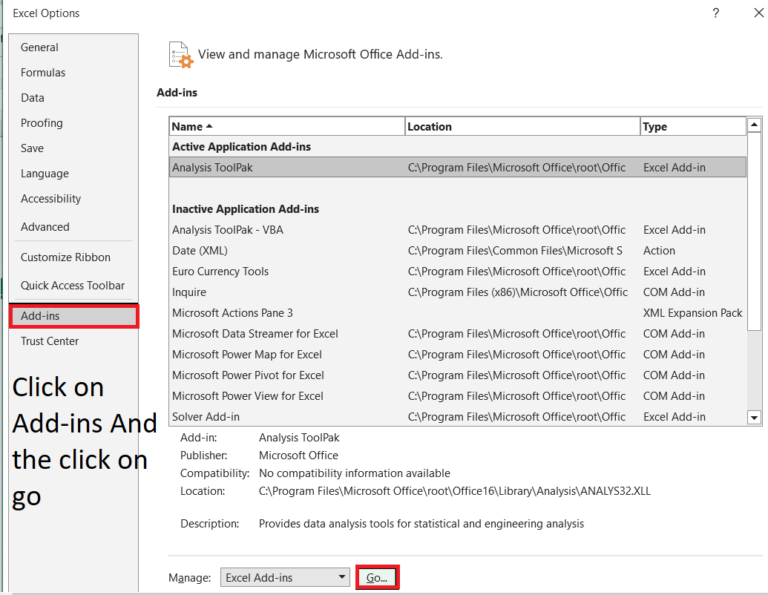
Step 4: Select the analysis toolpak option then press OK.

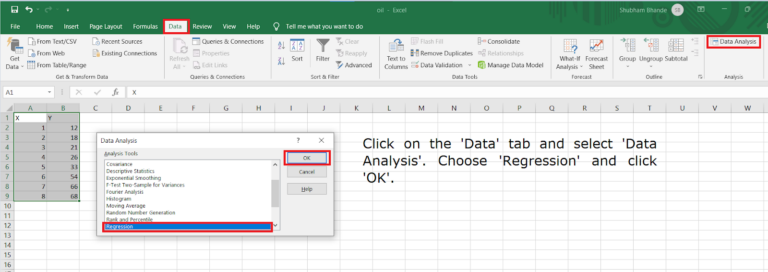
Step 5: Now the Data Analysis Option is available in Data Tab in Excel.

Step 6: Click on the ‘Data’ tab and select ‘Data Analysis’. Choose ‘Regression’ and click ‘OK’.
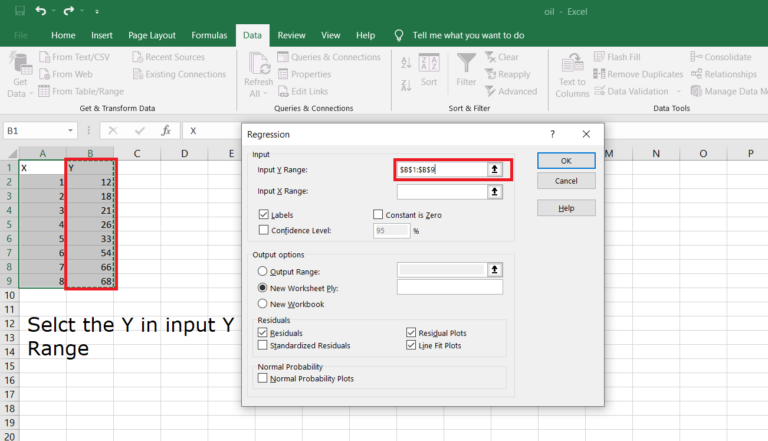
Step 7: Specify your input Y Range.
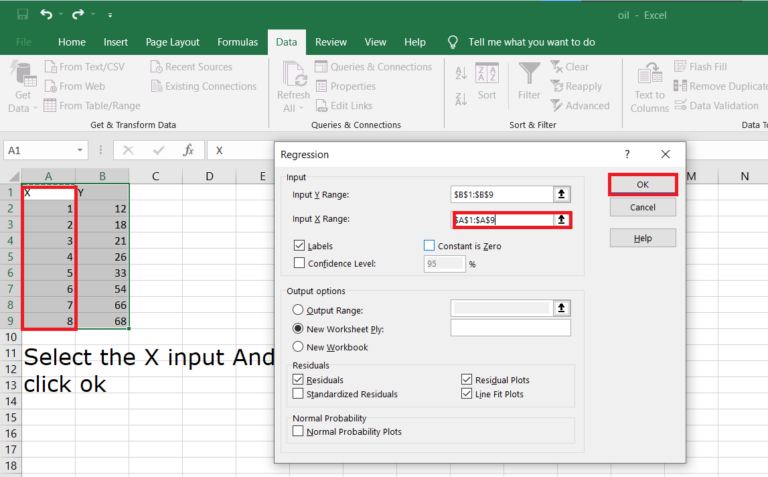
Step 8: Specify your input X Range.
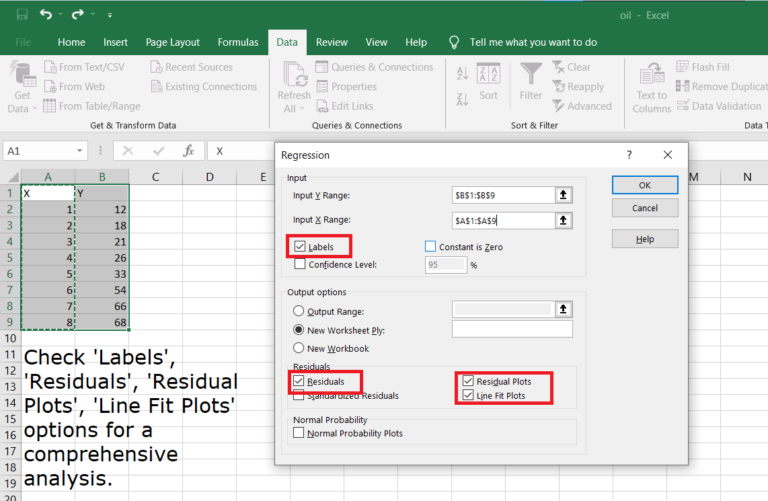
Step 9: Check ‘Labels’, ‘Residuals’, ‘Residual Plots’, ‘Line Fit Plots’ options for a comprehensive analysis.
Step 10: Click ‘OK’. The output will give you various statistics and plots for your analysis.
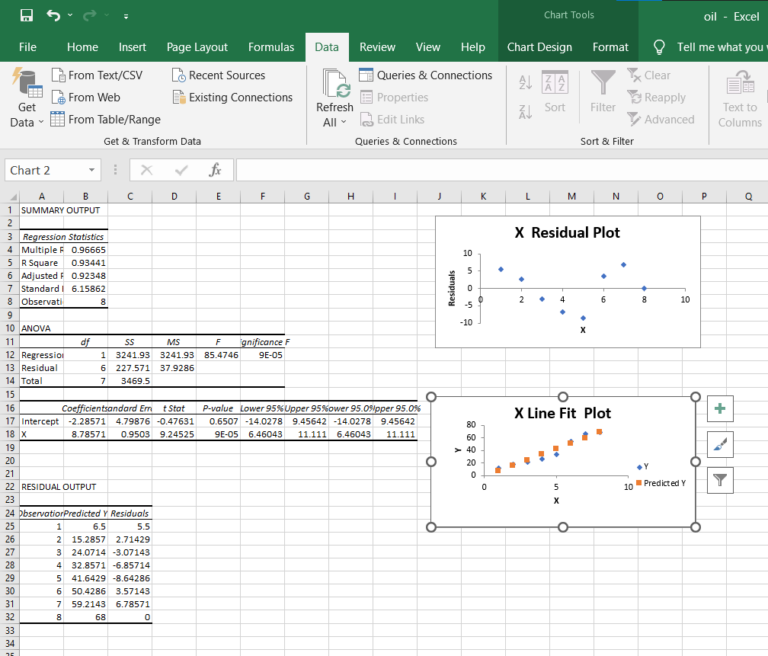
This method is used for large data set to make analysis easy and give the output in proper format.
Conclusion
In conclusion, Microsoft Excel’s capabilities extend far beyond basic data entry and simple calculations. It serves as a powerful tool for forecasting and predictive analytics, empowering users with data-driven insights that aid in strategic decision-making. Excel’s various functions, such as the FORECAST function for linear forecasting, trendline functions for non-linear forecasting, and the sophisticated Data Analysis ToolPak for advanced predictive analytics, provide an array of methods to extract meaningful information from complex datasets.
The strategic application of these tools can significantly impact business outcomes, providing future-oriented insights that help organizations anticipate trends and make informed decisions. However, it’s essential to understand the data thoroughly and the assumptions underlying these methods to ensure accurate and meaningful predictions. Therefore, while Excel simplifies complex analysis and makes forecasting more accessible, the responsibility lies with the user to apply these tools judiciously.
Finally, Excel’s role in forecasting and predictive analytics exemplifies how a widely used software can be leveraged beyond its conventional uses, effectively turning raw data into a powerful decision-making resource. Whether you’re in finance, sales, inventory management, or any other field dealing with large data sets and future predictions, Excel offers robust and versatile solutions to meet your forecasting needs. Excel, indeed, remains a cornerstone in the world of data analysis, offering a balance of simplicity, flexibility, and sophistication.


